PSD Optimizer
Example for the derivation of an equivalent PSD signal for shaker testing or other purposes. See the docu of the pylife psd_smoother function in the psdSignal class for more details
[1]:
import pandas as pd
import matplotlib.pyplot as plt
import numpy as np
from scipy import optimize as op
import sys
from pylife.stress.frequencysignal import psdSignal
import ipywidgets as wd
%matplotlib inline
[2]:
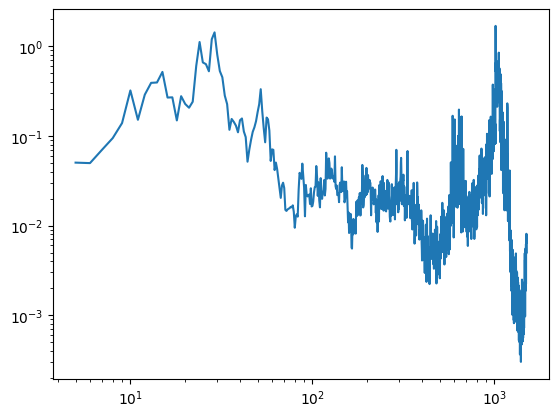
psd = pd.DataFrame(pd.read_csv("data/PSD_values.csv",index_col = 0).iloc[5:1500,0])
[3]:
#fsel = np.array([30,50,80,460,605,1000])
fsel = []
fig = plt.figure()
plt.loglog(psd)
txt = wd.Textarea(
    value='',
    placeholder='',
    description='fsel = ',
    disabled=False
)
display(txt)
def onclick(event):
    yval = psd.values[psd.index.get_loc(event.xdata,method ='nearest')]
    plt.vlines(event.xdata,0,yval)
    fsel.append(event.xdata)
    txt.value = "{:.2f}".format(event.xdata)
cid = fig.canvas.mpl_connect('button_press_event', onclick)
[4]:
fsel = np.asarray(fsel)
# please uncomment the following line. It is just for utomatization purpose
fsel = np.asarray([5,29,264,1035,1300,])
print(fsel)
[ 5 29 264 1035 1300]
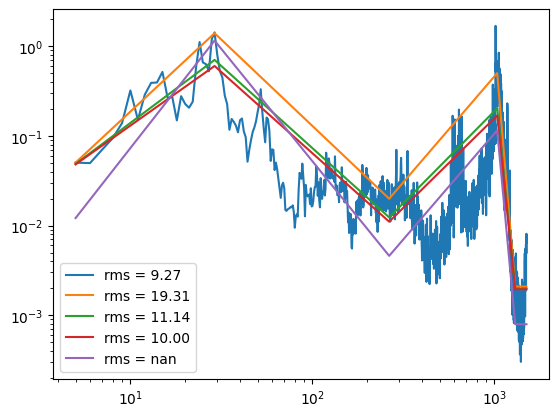
[5]:
def rms_psd(psd):
    return (sum(((psd.diff()+psd).dropna().values.flatten()*np.diff(psd.index.values)))**0.5)
plt.loglog(psd, label="rms = {:.2f}".format(rms_psd(psd)))
for i in np.linspace(0,1,4):
    psd_fit = psdSignal.psd_smoother(psd, fsel, i)
    plt.loglog(psd_fit, label="rms = {:.2f}".format(rms_psd(psd_fit)))
plt.legend()
[5]:
<matplotlib.legend.Legend at 0x799bf95af230>
[ ]: